Page: 1
/ 9
Total 134 questions
You have a Microsoft SQL Server Analysis Services (SSAS) cube that contains historical data.
In Power BI Desktop, you have the following query for the cube.
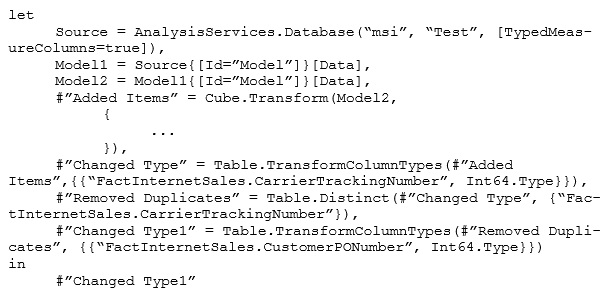
The query retrieves 25,499 records.
When you check the data warehouse that is the source of the cube, you discover that there are 26,423 records.
You need to ensure that the query retrieves all 26,423 records.
What should you do?
- A. From Query Editor, refresh all the data.
- B. Change the query to use Live connection mode.
- C. Delete the Remove Duplicates step.
- D. Add an Unpivot Columns step.
Answer : C
You have a query that retrieves sales data. A sample of the data is shown in the following table.

You need to ensure that the values in the Date column contain a date. Null values must be replaced with the date from the previous row.
What should you click on the Transform tab in Query Editor?
- A. Format, and then Clean
- B. Date, and then Earliest
- C. Fill, and then Down
- D. Replace Values, and then Replace Errors
Answer : C
References:
https://www.excelcampus.com/library/fill-down-blank-null-cells-power-query/
Your organization has a Microsoft Office 365 subscription.
When the users attempt to access the Power BI Service, they receive the error message shown in the exhibit. (Click the Exhibit button.)

You need to ensure that all the users can access the Power BI service.
What should you do first?
- A. From the Microsoft Azure Active Directory admin center, assign a Power BI (free) license to each user.
- B. From the Power BI Admin portal, modify the Tenant settings.
- C. From Microsoft Azure PowerShell, run the Set-MsolCompanySettings cmdlet.
- D. From the properties of each dashboard, modify the Share dashboard settings.
Answer : C
Explanation:
You need to run the following cmdlet: Set-MsolCompanySettings -AllowAdHocSubscriptions $true
You plan to use Power BI Desktop to import 100 CSV files.
The files contain data from different stores. The files have the same structure and are stored in a network share.
You need to import the CSV files into one table. The solution must minimize administrative effort.
What should you do?
- A. Add a folder data source and use the Combine Files command.
- B. Add a folder data source and use the Merge Queries command.
- C. Add a Microsoft Excel data source and use the Merge Queries command.
- D. Add text/CSV data sources and use the Append Queries command.
Answer : A
References:
https://docs.microsoft.com/en-us/power-bi/desktop-combine-binaries
You have the following two queries in Power BI Desktop:
-> A query named Query1 that retrieves a table named SMB_Customers from a Microsoft SQL Server database
-> A query named Query2 that retrieves a table named Enterprise_Customers from an Oracle database
Both tables have the same columns.
You need to combine the data from SMB_Customers and Enterprise_Customers.
Which command should you use?
- A. Combine Files
- B. Merge Queries
- C. Merge Columns
- D. Append Queries
Answer : D
References:
http://radacad.com/append-vs-merge-in-power-bi-and-power-query
You are creating a Power BI Desktop report that has several bar charts and a date slicer.
You need to create a slide show that can be viewed from the Power BI service. Each slide must display the charts filtered for a different year.
What should you do before you publish the report?
- A. Configure report level filters, and then create groups that use the List group type.
- B. Configure drillthrough filters for each bar chart, and then select Selection Pane.
- C. Filter the bar charts by using the slicer, and then create bookmarks.
- D. Configure page level filters, and then create groups that use the Bin group type.
Answer : C
References:
https://docs.microsoft.com/en-us/power-bi/desktop-bookmarks
DRAG DROP -
You create a report in Power BI Desktop.
You need to embed the report into a Microsoft SharePoint Online site.
Which three actions should you perform in sequence? To answer, move the appropriate actions from the list of actions to the answer area and arrange them in the correct order.
Select and Place:

Answer :

References:
https://powerbi.microsoft.com/en-us/blog/integrate-power-bi-reports-in-sharepoint-online/
You have a Power BI app named App1. The privacy for the App1 app workspace is set to Private.
A user named User1 reports that App1 does not appear in the My organization AppSource. App1 appears in the My organization AppSource for your account.
You need to ensure that User1 sees App1 from the My organization AppSource.
What should you do?
- A. From the app workspace, click Update app, configure the Access setting, and then click Update app.
- B. From the app workspace, share the dashboard.
- C. From the app workspace settings, add a member.
- D. From the app workspace, click Update app, configure the Content settings, and then click Update app.
Answer : A
You have a sales report in an app workspace. The report displays a map of sales by location and a bar chart of sales by year. The report has a slicer to filter the data by year.
You need to create a dashboard that contains visualizations. The solution must ensure that you can use the slicer to filter the data by year.
What should you do?
- A. Pin each visualization to the dashboard, and then add a web content tile.
- B. Add a page level filter, and then pin each visualization to the dashboard.
- C. Publish the app workspace.
- D. Pin the report as a live page.
Answer : D
References:
https://docs.microsoft.com/en-us/power-bi/service-dashboard-pin-live-tile-from-report
A data analyst publishes several Power BI visualizations to a blog.
You discover that some of the visualizations contain data that is considered private by your company.
You need to prevent the visualizations from being published to the blog.
What should you do?
- A. From the Power BI Admin portal, disable the Publish to web setting.
- B. From the Power BI settings, delete the embedded codes.
- C. From the Power BI Admin portal, disable the Share content with external users setting.
- D. From the dashboard settings, modify the Share dashboard settings.
Answer : A
References:
https://docs.microsoft.com/en-us/power-bi/service-publish-to-web
You have an app workspace that contains two datasets named dataset1 and dataset2. Dataset1 connects to a Microsoft Azure SQL database. Dataset2 connects to a Microsoft Excel file stored in Microsoft OneDrive for Business.
You create a report named Report1 that uses dataset1.
You pin Report1 to a dashboard named Dashboard1.
You publish the app workspace to all the users in your organization.
You need to delete dataset2 from the app workspace.
What should you do first?
- A. Delete Dashboard1.
- B. Delete Report1.
- C. Unpublish the app.
- D. Configure the refresh settings for Dataset2.
Answer : C
You create a report in the Power BI service.
You plan to provide external users with access to the report by publishing the report to a public blog.
You need to ensure that the report in the blog post will be updated as the data is refreshed.
What should you do in the Power BI service?
- A. Publish the app workspace to the entire organization. In the blog post, use the URL of the app workspace.
- B. Share the report. In the blog post, use the URL of the dashboard.
- C. Publish the report to the web. In the blog post, use the embed code URL.
- D. In the blog post, use the URL of the report.
Answer : C
References:
https://docs.microsoft.com/en-us/power-bi/service-publish-to-web
In the Power BI service, you create an app workspace that contains several dashboards.
You need to provide a user named [email protected] with the ability to edit and publish dashboards.
What should you do?
- A. Modify the members of the app workspace.
- B. Configure security for the dataset used by the app.
- C. Share the dashboard, and then modify the Access settings of the dashboard.
- D. From the app workspace, click Update app, and then configure the Access settings.
Answer : C
You embed a Power BI report in a Microsoft SharePoint Online page.
A user named User1 can access the SharePoint Online page, but the Power BI web part displays the following error message: "This content isn"™t available."
User1 is unable to view the report.
You verify that you can access the SharePoint Online page and that the Power BI report displays as expected.
You need to ensure that User1 can view the report from SharePoint Online.
What should you do?
- A. Publish the app workspace.
- B. Share the dashboard in the app workspace.
- C. Edit the settings of the Power BI web part.
- D. Modify the members of the app workspace.
Answer : A
You have a Power BI model that contains the following two tables:
-> Assets (AssetID, AssetName, Purchase_DateID, Value)
-> Date (DateID, Date, Month, Week, Year)
The tables have a relationship. Date is marked as a date table in the Power BI model.
You need to create a measure to calculate the percentage that the total assets value increased since one year ago.
Which DAX formula should you use?
- A. (sum(Assets[Value]) "" CALCULATE(sum(Assets[Value]), SAMEPERIODLASTYEAR("˜Date"™[Date])))/CALCULATE(sum(Assets[Value])), SAMEPERIODLASTYEAR("˜Date"™[Date])))
- B. CALCULATE(sum(Assets[Value]), SAMEPERIODLASTYEAR("˜Date"™[Date]))/ (sum(Assets[Value])
- C. CALCULATE(sum(Assets[Value]),DATESYTD(("˜Date"™[Date]))/ (sum(Assets[Value])
- D. (sum(Assets[Value]) "" CALCULATE(sum(Assets[Value]), SAMEPERIODLASTYEAR("˜Date"™[Date]))/
Answer : D